

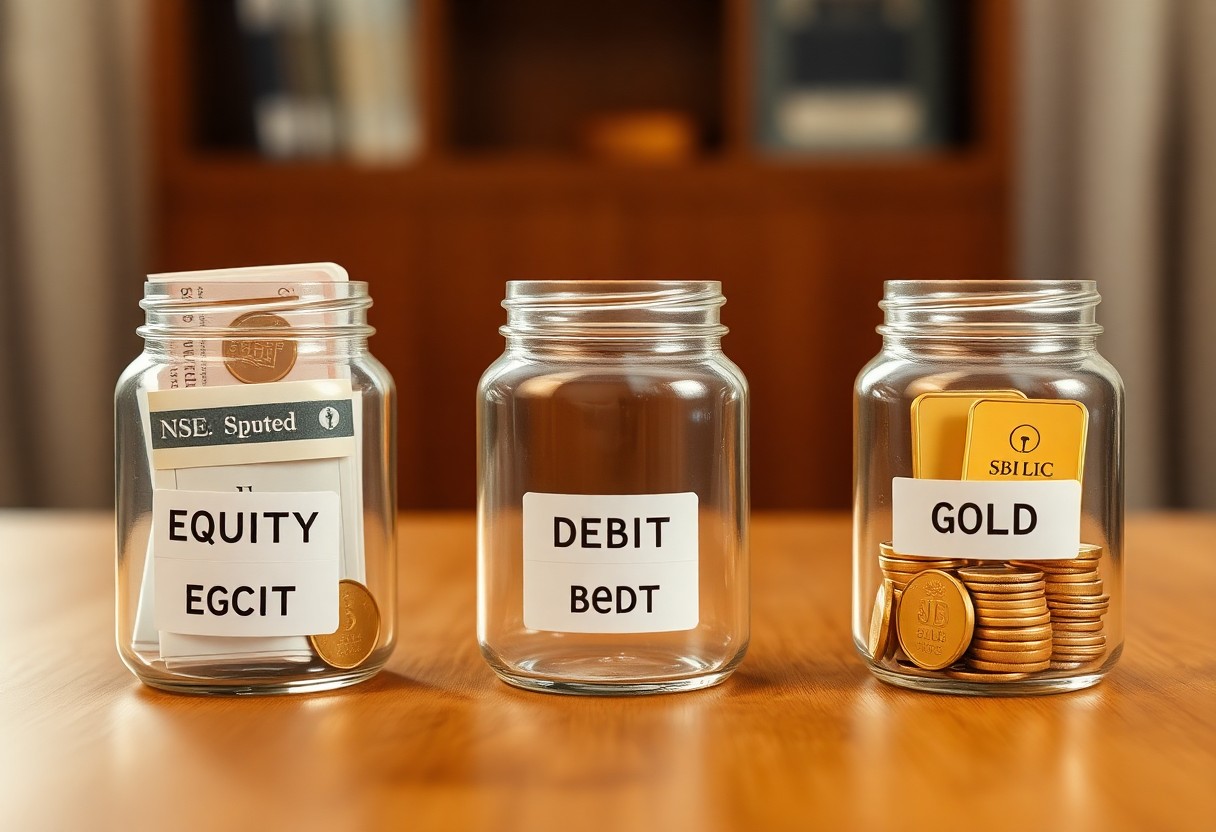
Strategy guides how you allocate across equity, debt and gold to align your financial goals, risk appetite and investment horizon; by combining growth-oriented equities, steady debt instruments and inflation-hedging gold, you can reduce portfolio volatility, pursue consistent returns and protect purchasing power in the Indian market while adjusting allocations as your objectives change.

Key Takeaways:
- Align allocation with goals and risk: equities for long-term growth, debt for stability and near-term needs; shift toward debt as goals approach.
- Account for taxes and inflation when choosing debt instruments; favour tax-efficient options and ladder debt exposure to manage interest-rate risk.
- Include a small allocation to gold (typically 5-10%) as an inflation/volatility hedge; prefer Sovereign Gold Bonds or ETFs and rebalance annually to maintain targets.
Understanding Asset Allocation
What is Asset Allocation?
You divide your portfolio among equity, debt and gold to match goals, risk and time horizon; common frameworks include the age rule (equity ≈ 100 − your age) and mixes like 60/30/10 (equity/debt/gold). For example, a 35‑year‑old aiming for wealth creation might hold 65% equity, 25% debt (PPF, FDs, gilt funds) and 10% gold (SGBs or gold ETFs) to balance growth with downside protection.
Importance of Asset Allocation for Indian Investors
You manage inflation, tax and market volatility by allocating across assets: Indian equities have delivered roughly 10-12% CAGR over long periods, debt instruments (PPF, government bonds) yield ~6-8% recently, and Sovereign Gold Bonds pay 2.5% interest plus inflation hedge. Tax differences matter-equity LTCG above ₹1 lakh is taxed at 10% (no indexation), while long‑term debt gains use 20% with indexation-so allocation directly affects your after‑tax returns.
You should apply allocation to goals: use ELSS/SIP for tax‑efficient equity growth, PPF or gilt funds for stable retirement income, and SGBs or gold ETFs for portfolio diversification; disciplined annual rebalancing after drawdowns (for example, buying equity during the March‑2020 dip) often lets you buy low and improve long‑term risk‑adjusted returns while keeping volatility suited to your timeline.
The Role of Equity in Investment Portfolios
Equity drives long-term growth in your portfolio by offering capital appreciation that often outpaces inflation; Indian large-cap indices have historically averaged around 10-12% annualized over multi-decade periods, while mid- and small-caps have delivered higher upside with greater variability. You should treat equity as the engine for wealth creation, balancing it against debt and gold to manage volatility and pursue your specific financial goals.
Types of Equity Investments
You can choose among individual stocks, mutual funds (active and passive), ETFs, sector/thematic funds, and international equities-each differs in cost, diversification and monitoring needs; for example, an index ETF may charge 0.05-0.5% expense ratio versus active funds at 1-2%, while stocks need hands-on research. Diversify across these buckets to reduce company-specific risk and align with your time horizon.
- Individual stocks – concentrated bets with high alpha potential but high monitoring.
- Large-cap funds/blue-chips – more stability, regular dividends, lower volatility.
- Mid/small-cap funds – higher historical upside, greater drawdowns in downturns.
- ETFs/index funds – low cost, broad market exposure, simple tax handling for you.
- Assume that you blend these types to match risk tolerance, e.g., 60% large-cap, 25% mid/small, 10% ETFs, 5% international for a growth tilt.
| Individual Stocks | High upside, high monitoring, company-specific risk; suitable if you can analyze fundamentals. |
| Large-cap Funds / Blue-chips | Lower volatility, steady dividends; historically ~8-12% long-term returns in India. |
| Mid/Small-cap Funds | Potential 12-18%+ upside historically, but with larger drawdowns and higher standard deviation. |
| ETFs / Index Funds | Very low expense ratios (0.05-0.5%), passive market exposure, tax-efficient for long-term holding. |
| International Equities | Currency diversification and sector access (e.g., US tech, EU healthcare); adds geo-specific risk. |
Risks and Returns Associated with Equity
Equity can deliver real returns above 8-12% annually over long horizons, but you must accept volatility and sizable drawdowns-bear markets have cut values by 30-60% (e.g., 2008, 2020). You should match equity exposure to your time horizon, use SIPs to average purchase cost, and maintain an emergency liquidity buffer so short-term needs don’t force selling at lows.
You can manage risk by diversification (across caps, sectors, countries) and periodic rebalancing; measure portfolio risk with metrics like standard deviation and maximum drawdown-Indian mid-cap funds may show >30% volatility historically. For a 40-year-old targeting retirement in 20-25 years, a sample split is 60% equity (40% large-cap, 15% mid/small, 5% international), 30% debt and 10% gold, with annual rebalancing to lock in gains and control drift.
The Role of Debt in Investment Portfolios
You rely on debt to steady returns, provide predictable income and lower portfolio volatility; for example, high-quality government bonds have historically offered yields around 6-7% while bank FDs and AAA corporate bonds add incremental yield. You can explore how multi-asset funds mix debt with equity in practice in this note: Is your Multi Asset Allocation Fund truly DIVERSIFIED?
Types of Debt Instruments
You’ll find a spectrum from ultra-short T-Bills to long-duration G-Secs and credit-risky corporate bonds; each serves a different role-liquidity, inflation hedge, income or yield enhancement. Choose instruments based on tenor, credit quality and your cash-flow needs to align with liabilities or drawdown scenarios.
- Treasury Bills (T-Bills): zero-coupon, very short tenor, high liquidity.
- Government Securities (G-Secs): longer tenor, low credit risk, rate-sensitive.
- Corporate Bonds: higher yields, credit spread depends on rating (AAA vs BBB).
- Bank FDs / PSU Bonds: predictable coupons, suitable for conservative income.
- Assume that you mix tenors and credit profiles to balance yield, duration and default risk.
| Treasury Bills (T-Bills) | Tenor: <1 year; Yield: low; Purpose: liquidity and cash park |
| Government Securities (G-Secs) | Tenor: 2-30 years; Yield: benchmark ~6-7%; Purpose: duration play, safety |
| State Development Loans (SDLs) | Tenor: medium-long; Yield: slightly above G-Secs; Purpose: tax/municipal exposure |
| Corporate Bonds | Tenor: short-long; Yield: G-Sec+1-4% (rating dependent); Purpose: yield pickup |
| Bank FDs / PSU Bonds | Tenor: flexible; Yield: fixed coupons ~6-8% (varies); Purpose: steady income |
Benefits of Including Debt
You gain capital preservation, steady coupon income and reduced portfolio drawdowns-debt often falls less than equities during market stress; for example, a 60/40 equity/debt mix historically lowered annualized volatility by several percentage points versus an all-equity portfolio.
When you rebalance, debt provides dry powder to buy equities at lower prices, and high-quality debt can act as a liability hedge for goals with fixed timelines (e.g., 5-7 year home purchase). In India, using a mix of short-duration debt for liquidity and AAA corporate or G-Secs for core safety helps you target returns while keeping sequence-of-returns risk in check.
The Role of Gold in Asset Allocation
You should treat gold as a portfolio diversifier and inflation shield that typically behaves differently from stocks and bonds; central banks hold roughly 34,000 tonnes globally while Indian households own an estimated 25,000 tonnes, reflecting structural demand. During equity sell-offs (2008, 2020) gold often rose as you trimmed risk elsewhere, so many advisers recommend a tactical 5-10% allocation for most investors, rising to 10-15% if you expect prolonged inflation or currency weakness.
Historical Significance of Gold
You can trace gold’s role from coinage and reserves to modern jewellery and financial assets; in India festivals and weddings drive annual demand spikes, influencing imports and local prices. Households historically use gold as savings and a hedge against rupee depreciation, which explains why physical holdings, temple donations and family heirlooms remain significant components of Indian net worth.
Gold as a Hedge Against Inflation
You’ll find gold preserves purchasing power over long periods, often rising when consumer prices climb or real yields fall; during past inflationary phases and crisis periods gold has outperformed nominal bonds and protected wealth. Because it typically shows low or negative correlation with equities in stress periods, you can use it to reduce portfolio volatility and offset currency-driven inflation risks.
You should also weigh how you hold gold: Sovereign Gold Bonds offer fixed interest (around 2.5% p.a.) plus price appreciation, ETFs give low-cost, liquid exposure, and physical gold (coins/jewellery) brings storage and making charges. Factor in liquidity needs, tax treatment and holding costs when deciding whether SGBs, ETFs or physical metal best serve your inflation-hedging objective.
Determining the Ideal Asset Mix
You set your ideal mix by balancing time horizon, return targets and volatility you can tolerate; a classic 60:40 equity-debt split often suits medium-term goals, while younger investors commonly tilt 70-90% to equity for growth. In India, adding 5-10% gold (SGBs or ETFs) can reduce portfolio drawdowns, and using tax-efficient vehicles like ELSS or PPF improves after-tax returns.
Factors Influencing Asset Allocation
Your allocation hinges on measurable variables and practical constraints:
- Time horizon: short (<5 years) → more debt; long (>10 years) → higher equity weight
- Risk tolerance: conservative vs aggressive determines equity band
- Liquidity needs: maintain 6 months emergency fund in cash/liquid debt
- Tax, costs and product choice: ELSS, LTCG rules, expense ratios
After you combine these factors and run scenario tests, you can choose a model (e.g., 60/30/10) and tweak it to your situation.
Age, Risk Tolerance, and Financial Goals
You can apply simple rules of thumb like equity = 100 − your age (or 120 − age for a more aggressive posture). For example, at 30 you might target 70-90% equity depending on risk, while at 55 you’d reduce equity to roughly 45-65%. Align allocations with concrete goals-short-term house purchase calls for more debt, long-term retirement favors equity.
To refine allocations, quantify your risk with questionnaires and stress tests (simulate a 30% market drop to see your likely reaction). Consider a practical allocation: if you’re 35 aiming to retire at 60 with moderate risk, you might hold 70% equity (40% large-cap index funds, 20% mid/small-cap, 10% international), 20% debt (PPF, gilt funds) and 10% gold (SGBs/ETFs); rebalance annually and shift gradually toward debt as timelines shorten.
Monitoring and Rebalancing Your Portfolio
Monitor your portfolio monthly or quarterly to detect allocation drift and performance gaps; set a tolerance band (commonly 5%) so you act when equities slip from 60% to 54% or rise to 66%. Use fund fact sheets and multi-asset examples like Invesco India Multi Asset Allocation Fund for benchmarking and tactical ideas you can adapt to your goals.
The Importance of Regular Review
Reviewing quarterly helps you spot sector concentration, rising expense ratios, or tax events that affect returns; for instance, if one stock contributes over 10% of portfolio gains but increases volatility, you may trim exposure. You should track returns against benchmarks, volatility (standard deviation), and your target allocation, and update reviews after life changes like salary increases or nearing retirement.
Strategies for Rebalancing Your Investments
Use calendar rebalancing (annual) for simplicity, threshold rebalancing (5-10% drift) for responsiveness, or a hybrid approach; for example, rebalance when equity drifts beyond ±5% or at year-end. You can also direct new SIP contributions to underweight assets and harvest losses to offset gains, reducing transaction costs and tax impact while restoring target weights.
Consider trade-offs: more frequent rebalancing reduces drift but raises brokerage, STT and tax impact (often 0.1-1% per trade collectively), while less frequent rebalancing risks larger deviations from targets. Automate with platform tools or use multi-asset funds to outsource rebalancing, and simulate past three- to five-year scenarios to see how different rules would have affected returns and volatility for your specific allocation.
Summing up
Upon reflecting, you should structure your portfolio by aligning equity for growth, debt for stability and income, and gold as an inflation and volatility hedge; set allocations based on your risk tolerance and time horizon, use systematic investments and periodic rebalancing, be tax-aware and cost-conscious, and adjust allocations as life goals change.